Introduction
Each year iFusion® Research conducts a survey of soybean growers in Manitoba, Ontario and Quebec after harvest. What is unique about this study compared to other surveys is it collects results at the variety level and it is done after-harvest when soybean growers know their yield and quality results from their harvest.
By collecting the results by variety, we know accurately what the end-use that variety is used for (food grade vs oil/crush), CHU, variety traits and seed company. Furthermore we ask about the variety’s performance on such things as yield, quality, and a host of other attributes the growers use to evaluate their variety.
We also find out how weather has impacted their crop and sources of information they use in deciding which soybean variety to use.
This study is used by seed companies to understand their market share, how their varieties are rated on a number of characteristics and what characteristics and sources of information they used when deciding on a variety to grow.
The results you will see below are only a snippet of the information that sponsors of the study see, however, our intent here is to give soybean growers and other interested parties an overview of the results without de-valuing the investment these sponsors have made.
Information presented here cannot be used for publication without the express written consent of iFusion® Research.
Overall Soybean Acres and End Use
Soybean planted acres were near identical to 2021[1]. Although Manitoba acres dropped by 13.8%, increases in Ontario and Quebec made up the difference.
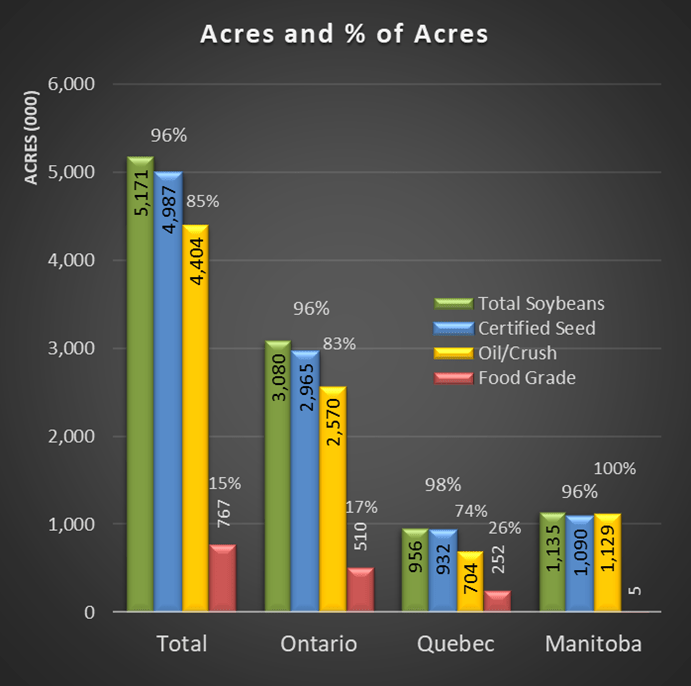
Of the 5, 171,100 planted acres of soybeans in the three provinces, 96.4% or 4,986,502 acres were planted with certified seed.
Of planted acres 85% were oil/crush varieties and 15% food grade varieties, with food grade varieties dropping in acres by 15.4% from 2021.
There were only about 5k acres of food grade varieties planted in Manitoba, however, Quebec planted food grade varieties on 26% of soybean acres with Ontario at 17%.
Seed company share by end use is also calculated in this study but only made available to sponsor of this study.
Suffice to say that Pioneer®, DEKALB® and NK® had the highest share of oil/crush acres and NK®, Prograin® and SeCan had the highest share on food grade acres.

Soybean Herbicide Tolerant Traits
Roundup Ready 2 Xtend® varieties had the highest overall share of soybean acres (57%) up from 54% in 2021 with higher share in Manitoba (64%) and Ontario (57%) compared to Quebec (50%).
Conventional varieties (aka food grade varieties) overall share was 2nd highest (15%), however share was down from 18% in 2021. Share was significantly higher in Quebec (26%), followed by Ontario (17%) with less than 1% share in Manitoba.
Roundup Ready 2 Yield® variety share was significantly higher in Manitoba (26%) and significantly lower in Ontario (8%) and in-between in Quebec (13%).
EnlistE3® varieties had very low share overall (4%), however, double from 2021 used in Ontario (5%) and Quebec (3%) and not used in Manitoba.
XtendFlex® varieties on the market for the first year, had an estimated 70k acres planted only in Ontario where it picked up a 2% share.
Soybean Yields
Weighted Average Yield is calculated by taking into account the varieties yield and its acreage to derive total production.

The overall weighted average yield across all varieties and all provinces was 48.4 bushels with yields significantly higher in Ontario (50.6) and lower in Quebec (44.9) and Manitoba (45.8).
Ontario and Quebec yields in this study are very similar to Statistics Canada[1]. 2022 soybean yields at 49.3 in Ontario and 44.6 in Quebec, however, iFusion Research has calculated a higher yield in Manitoba (45.8), compared with the Statistics Canada Manitoba soybean yield of 39.1.
Food grade varieties had a significant lower overall yield of 45.7 bushels per acre compared to oil/crush varieties at 48.8 bushels per acre.
Yields were calculated up for each seed company and herbicide technology system based on the variety. Although there appears to be differences between companies and herbicide technology, none of the yields were significantly different from the total market.
Roundup Ready 2 Yield® varieties had lower yields compared to other herbicide tolerant traits. This lower number reflects the impact of cold/wet weather conditions early in the season in Quebec where these varieties have a much higher share of that market.
Although a small sample for XtendFlex® varieties, the yield of 56.3 bu/acre was higher than other technology systems.
Yields are also calculated by seed company, however, these results are only available to sponsors of the study.
Weather Impact on Soybean Crop
A variety of different weather conditions negatively impacted the soybean crop with the majority of soybean growers throughout the season in all three provinces in 2022. Every year brings weather challenges.
The nature of the weather conditions varied across geographies with different regions having unique problems.
Overall, 70% of growers said weather conditions negatively impacted their soybean crop in 2022 and 56% with early season impacts, 47% with late season impacts and 10% with an impact at harvest.
Weather conditions had less of an impact in Manitoba in 2022 compared to 2021, where 97% of growers experienced negative impacts in 2021, compared to 48% in 2022.
Weather conditions had more of an impact on the soybean crop in Ontario and Quebec in 2022 than in 2021. Ontario went from 59% of growers in 2021 to 73% in 2022 and Quebec from 66% to 72%.
In 2022, early and late season weather conditions negatively affected the crops of many growers in all three provinces, whereas; harvest weather conditions only affected a few in all three provinces in stark contrast to wet fields afflicting many soybean fields at harvest in 2021.
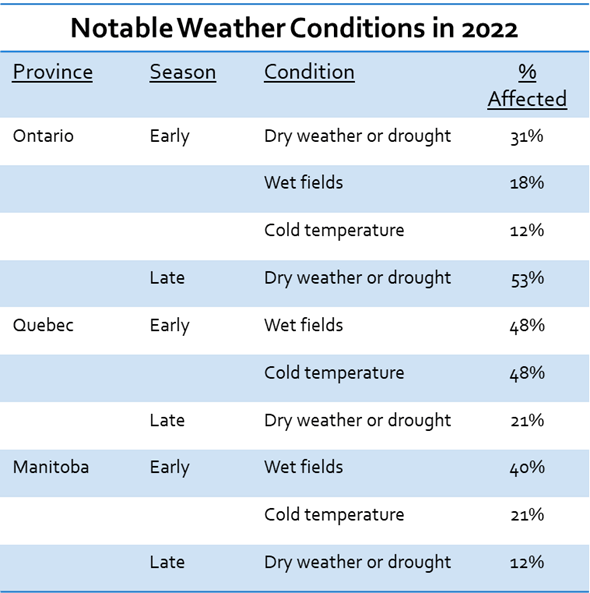
Quebec soybean growers experienced poor growing conditions early in the season (68%), the main causes being cold and wet fields (48% each) and late in the season (27%) from dry weather (21%).
In Ontario, soybean growers experienced poor growing conditions early in the season (54%), the main causes being dry weather (31%) in some areas and in other areas, wet fields (18%) and cold (12%). Late in the season dry weather was the issue affecting 53% of soybean growers.
In Manitoba, soybean growers experienced poor growing conditions early in the season (45%), the main causes being wet fields (40%) and cold temperatures. (21%) and late in the season (26%), mainly from dry weather (12%) with some growers and wet fields with others (8%).
Poor weather conditions negatively impacted variety satisfaction rates and soybean yields were on average 6.4 bushels per acre lower with those who experienced poor weather of some type.
Soybean Variety Satisfaction
Soybean growers are asked to rate their satisfaction on 11 different characteristics of soybean varieties, along with their overall satisfaction of the variety on a five point scale.
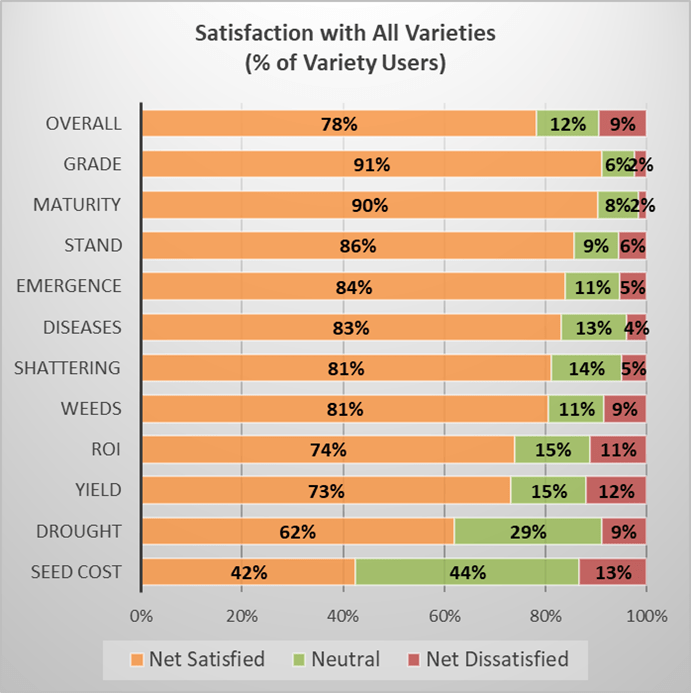
The adjacent chart shows a summary of the net satisfaction (satisfied, dissatisfied and neutral) across all soybean varieties showing overall satisfaction and satisfaction on 11 different characteristics.
On overall satisfaction, 78% of variety users were satisfied, 9% were dissatisfied and 12% were neutral.
Satisfaction among the characteristics was highest with Grade, Maturity, Stand and Emergence, in that order, and satisfaction was lowest with Seed Cost, Drought (tolerance), Yield and ROI in that order.
In the detailed report for sponsors, satisfaction is broken down into the five point scale and summarized by province, seed company, end use and herbicide tolerant systems etc.
Selecting a Soybean Variety
The most important factors, overall in 2022, in selecting a soybean variety were high yield and high return on investment (ROI) with share of preference 26% and 17% respectively, however both declined from 2021 from 32% and 26% respectively.
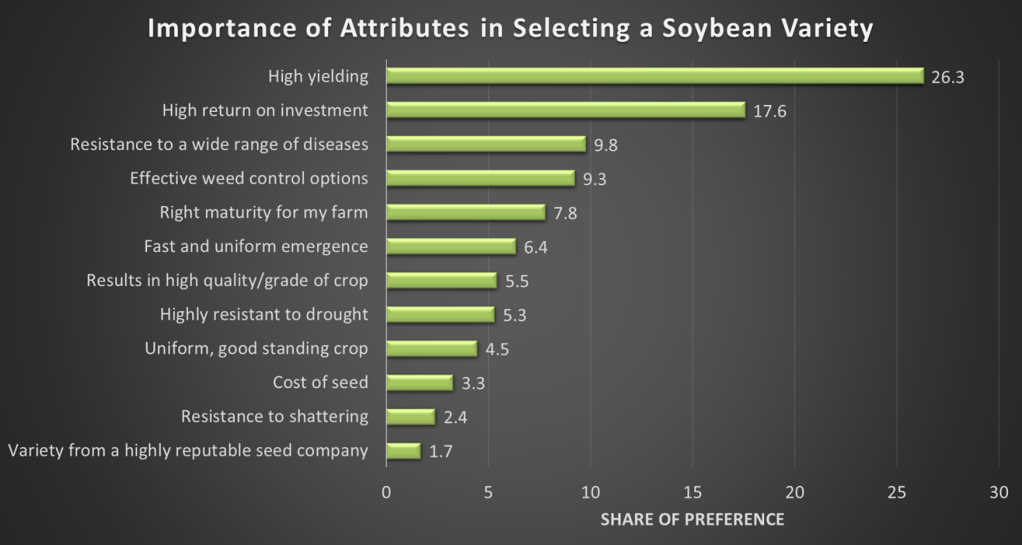
Share of preference for resistance to a wide range of diseases (10%) was #3 in rank in 2022 up from 4% in 2021 with a rank of #8. Highly resistant to drought, although still low in share in 2022 at 5% rose from 2% in 2021.
The importance of some attributes was significantly different across provinces and end use category, however, not by seed company users or technology systems with one exception on quality being more important with conventional variety and food grade only growers.
Yield and ROI were the top two preferred attributes across end use category and in Ontario and Manitoba , however in Quebec, resistance to a wide range of diseases was in the #2 rank after yield.
Maturity was more important and emergence, drought resistance and stand was less important in Manitoba compared to Ontario and Quebec.
After yield and ROI, the next two attributes in overall importance are pest related, namely resistance to wide range of diseases and effective weed control options.
The remaining attributes, with exception of seed company reputation and seed cost, are all agronomic or plant health related attributes and are of secondary importance overall in the market.
The reputation of the seed company is the least important in the selection of a variety, followed by, resistance to shattering and cost of the seed.
Information Sources used in Soybean Variety Decision Making
Soybean growers were asked which information sources they used in their decision making process for soybean seed varieties as well as what point in their decision making process due they use the various information sources along the way from starting to think abut purchases to making their final decision and other steps along the way.
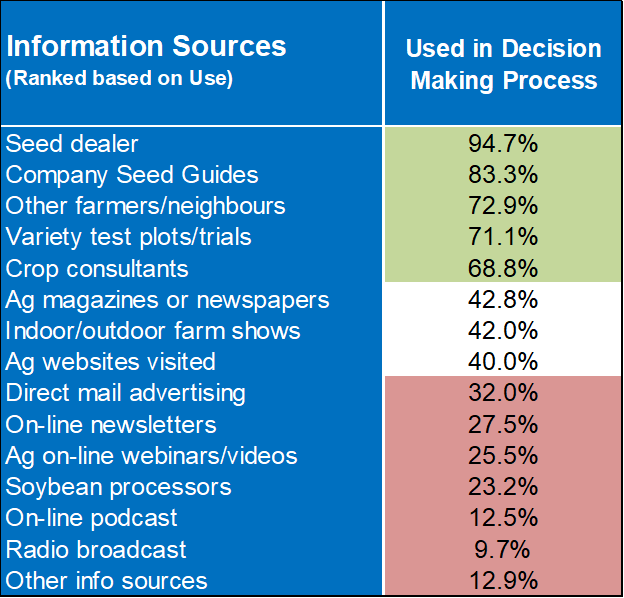
The adjcent table shows only the results of their overall use of information sources.
Seed dealers (95%), company seed guides (83%), other farmers/neighbours (73%) , variety test plots/trials (71%) and crop consultants (69%) are the most widely use sources of information for soybean variety decisions.
Ag magazines or newspapers, indoor/outdoor farm shows and Ag websites are each used by about 40% of soybean growers for variety information.
The remaining information sources are used less often, however, are still used by between 10 and 32% of growers.
[1] All acreage data is weighted based on Statistics Canada Soybean acres by province each year. Reference: Table 32-10-0359-01 Estimated areas, yield, production, average farm price and total farm value of principal field crops, in metric and imperial units.
iFusion is a registered trademark of iFusion Research Corp. DEKALB, Ready Ready 2 Xtend, Roundup Ready 2 Yield and XtendFlex are registered trademarks of Bayer Group. NK is a registered trademark of Syngenta Group Company. Pioneer and EnlistE3 are registered trademark of Corteva Agriscience and its affiliated companies. Prograin is a registered trademark of Semences Prograin Inc.
